- Home
- Realtime Stazione
- Stazione affiliata
- Su Wunderground
- Su Google Maps di Weathersicily
- Su Google Maps di Meteosicilia
- Su Meteo4
- Linea Meteo
- Meteocloud
- Calabria Weather Data
- Meteorete
- Pws Weather
- CWOP DW 2770
- APRS DW 2770
- Findu DW 2770
- Madis DW 2770
- Windy.com DW 2770
- Su Windsurf DW 2770
- Su Windalert DW 2770
- Weatherobs DW 2770
- Meteo Palermo
- Weathersicily
- MeteoSicilia
- Reti
Sias
- Home
- SIAS Mappe giornaliere
- Dati Stazioni SIAS
- Grafici
- Dati Stazioni in Telemisura
- Rete di rilevazione (e precipitazioni 24H)
- Bollettini Meteorologici
Meteomont
Rete Meteo DRPC - AdB
- Aegis - Protezione Civile Sicilia
- Mistral
- Stazioni Idrografiche storico con foto
- Centro Funzionale Decentrato Idro
- Autorità Bacino Distretto Idro
- Annali Idrologici Autorità Bacino
- Volumi invasati nelle dighe
- Report Siccità
- Piano Stralcio Bacino Idro
I.N.G.V.
Arpa Sicilia
Rete DCP in Sicilia
- Mappa delle stazioni e strumenti
- Catania Fontanarossa
- Catania Sigonella
- Comiso
- Cozzo Spadaro
- Enna
- Gela
- Gibilmanna DCP
- Lampedusa
- Messina
- Mezzo Gregorio DCP
- Palermo Punta Raisi
- Pantelleria
- Prizzi
- Salina DCP
- Sciacca DCP
- Siracusa DCP
- Stromboli DCP
- Trapani Birgi
- Ustica
Rete Mareografica
Rete Ondametrica
Gaw
Calypso south
- Previsioni
Cefalù
- Previsioni by UKMO - ETA - ECMWF
- Previsioni by Yr.no
- Previsioni su Icona Meteo
- Previsioni su Meteored
- Previsioni di 3bmeteo
- Previsioni Weathersicily
- Previsioni di Centrometeo
- Previsioni di Nordicweather
- Meteogramma per Cefalù a 7 giorni
- Meteogramma Cefalù 2
- Meteogramma Cefalù Troposferica
- Previsioni Mare
- Previsioni Mare 2
- Previsioni Marea
- Allerte Meteo
- Qualità dell'aria
- Grafico Ensemble
- Percorso Stelle
- Navi in porto Presidiana
- Stazioni Meteo in territorio di Cefalù
- Webcam Live Cefalù
- Webcam Live Cefalù 2
- Webcam Live Cefalù 3
- Webcam Live Cefalù 4
Madonie
- Dati Meteo Gibilmanna DCP
- Previsioni Gibilmanna by EWN
- Meteogramma Gibilmanna
- Webcam WS Piano Battaglia
- Stazione Meteo Piano Battaglia 1
- Stazione Meteo Piano Battaglia 2
- Stazione Meteo Piano Battaglia 3
- Stazione - Webcam Monte Mufara
- Stazione meteo di Isnello SP54 DRPC
- Meteomont Piano Battaglia
- Previsioni Meteo di Piano Battaglia
- Previsioni Pizzo Carbonara by EWN
- Meteogramma Pizzo Carbonara
Isole Eolie
Sicilia
- Previsioni Weather Sicily
- Previsioni Meteo SIAS
- Estremi Meteo Sicilia
- Radiosondaggio di Trapani
- Protezione Civile Sicilia
- Climatologia della Sicilia
- News Meteo Sicilia
- Webcam in Sicilia
- Webcam in Sicilia 2
Italia
- Previsioni Meteo
- Dati Meteo in Tempo Reale
- Osservazioni Synop Italia
- Osservazioni Synop Italia 2
- Osservazioni Synop - Metar
- Allerte Meteo Italia
- Allerte Meteo Italia 2
- Bollettino di Vigilanza Meteo Prot.Civ.
- Meteoalarm
- Estremi Italia
- Classifica Temperatura Stazioni Ufficiali
- Classifica Venti Stazioni Ufficiali
- Bollettino climatologico Italia
- Weather Station Records Italia
- Statistiche stazioni meteo Wmo Italia
- Meteo Giornale (Notizie e Previsioni)
- The Weather (in italiano)
- Attività Solare - Clima -Meteo
- Climatemonitor
- Osservazioni
- Tempo in atto A.M. Italia
- Venti in atto in Italia
- Temperature Attuali in Europa
- Osservazioni Synop Globo
- Previsione del Mare A.M.
- Avviso di Burrasca
- Rete Mareografica Nazionale
- Temperatura Mare by Navi e Boe Marine
- SST-Mediterraneo - Lamma
- SST-Mediterraneo - Ceam
- SST-Global
- Mediterranean Observing System
- Emodnet
- Sea level station monitoring
- Sea level station monitoring Italy
- Venti Live Mediterraneo
- Radiosondaggio Europa
- Analisi e Osservazioni in Altitudine Europa
- Meteo Allerta Europa
- Estremi Meteo Globo
- Dati Meteo Boe Globo
- Traffico Navale
- Traffico Aereo Live
- Analisi meteo
- Modelli meteo
- WS-Lam 4 km - GFS Sicilia
- Pioggia Sicilia - Lamma
- Lamma - Sicilia
- Poseidon - Sicilia
- Meteonetwork
- Il Meteo.net
- Wetterzentrale
- Modello ECMWF
- Wxcharts - Europa
- Pivotal Weather - Italia
- Lam - Meteogiornale
- Modello Bolam-Moloch
- WRF-ARW 30km
- Convective Weather Maps
- WeatherOnline G.F.S.
- WRF - Italia - Lamma
- Archivio Storico Modelli Meteo
- Temporali
- Fulmini - Sicilia
- Fulmini e Densità - Sicilia
- Temporali in Animazione
- Scariche elettriche +Nubi
- Mappa Live Fulmini
- Fulmini Italia
- Fulmini Italia Meteociel
- Blitzortung
- Mappa Live Blitzortung
- Mappa Google Blitzortung
- Mappa Google Blitzortung 2
- Lighting Forescats
- Mappa Previsioni Temporali
- Mappa Previsioni by Pretemp
- Satelliti
- Satellite by il Meteo.net
- Portale di Eumetsat
- SAT 24 (.com)
- Sicilia by Windy
- Zoom Sicilia - Nasa
- Sicilia Kachelmannwetter
- Satellite da Climatologia
- Satellite da 3B meteo
- Satellite da Parkstad
- Satellite da Yr.no
- Satellite da Abruzzo Meteo
- Immagini Satellite Meteosat 9
- Total Precipitable Water- Global
- NwcSaf
- EODA
- Sentinel
- SSEC.WISC
- AMSR-2
- Chmi.Cz
- Wokingham Weather
- Northeast Atlantic Imagery
- Sicilia by Noaa-Cimss
- Satellite Modis Nasa Europa
- Satelliti Polari
- Goes East-Noaa
- CIMSS Tropical Cyclones Group
- Hurricanezone
- Tropical Ramsdis Online
- NASA - Earth
- ESA - Earth
- Earth Observatory - Nasa
- Earth Data - Nasa
- Eumetsat
- Archivio storico satellite dal 1981
- Neve e Ghiaccio
Mappa Sinottica Sud Italia + Dati Meteo Metar e Synop Stazioni Ufficiali - Navi
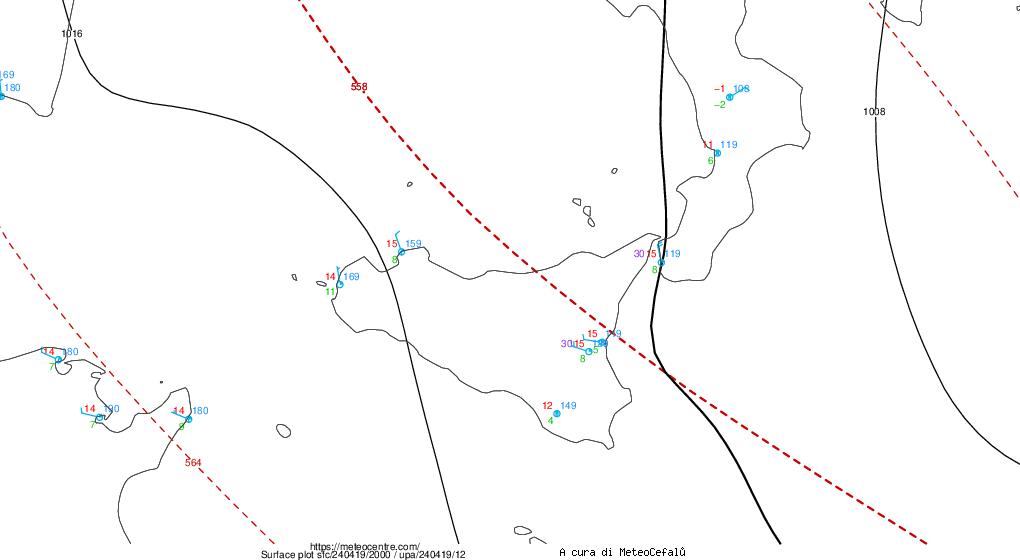
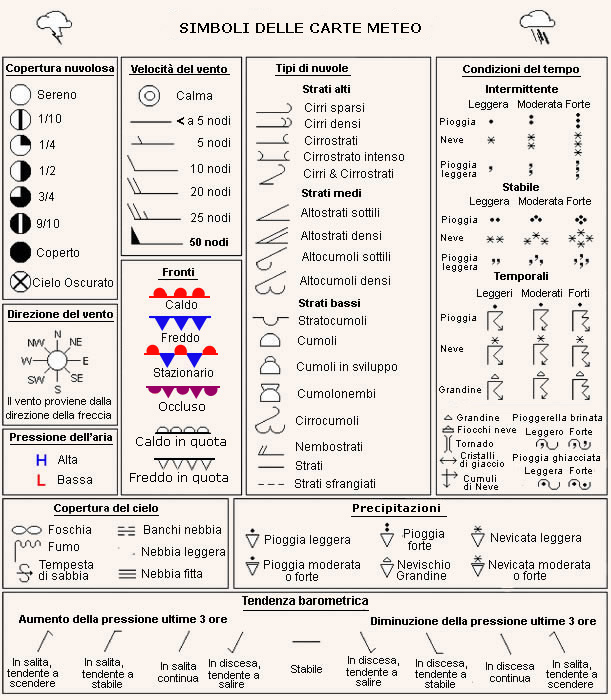
Weather symbol legends
- Red (upper-left): temperature (°C)
- Green (lower-left): dewpoint (°C)
- Blue (upper-right): abbreviated mean sea-level pressure in hPa (=mb). To get the pressure value, just put a 10 or a 9 in front of the displayed value and divide by 10: only one of these choices will give a realistic value.
- Magenta (center-left): weather symbol (vedi successiva tabella con i SIMBOLI DELLE CARTE METEO)
- Blue (center): cloud cover in octa
- Blue (barb): wind speed in knots and wind direction
- Orange: pressure tendency in the last 3 hours in tenth of hPa
- Purple (left-upper-left): Wind gust in knots
- Upper-center and lower-center (few stations): cloud type symbols
- Black lines: pressure (hPa=mb) lines each 4 hPa analyzed with Barnes algorithm from surface observations and first guess model data (digital filter)
- Red dashed-lines: geopotential height at 500 hPa each 6 dam analyzed with Barnes algorithm from upper-air observations and first guess model data
- Stazione affiliata